Archived Under Featured
Changing Dynamics
Matt Harris – Aperture Research Partners
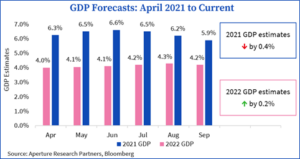
Economic data began to slow at the beginning of Q2, as supply chain disruption and labor shortage put pressure on companies’ ability to meet demand. Concerns further accelerated when the fourth wave of COVID-19 slowed economic progress, and in some areas of the country, reversed some of the re-opening progress that had been made during the second quarter.
This caused economists to cut expectations, with 2021 GDP expectations declining from 6.6% in June to the current 5.9%. During this time, economic data continued to disappoint and was regularly missing economists’ expectations. Missing the new, lower expectations is what caused the more pronounced growth scare over recent months.
Now What?
- Growth forecasts for 2022 have been increasing over the same period. It is not enough to offset the decline in 2021 output, but the weakness does look to be contained to 2021.
- What was a headwind to become a tailwind.
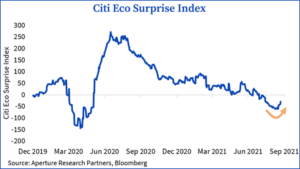
- I use Citi’s Economic Surprise Index to measure economic data vs. expectations. A level above zero indicates data is beating expectations and a level below zero indicates data is missing expectations. Shown below, at the beginning of August data began to miss expectations but over the last few weeks, with the proverbial bar lowered, this trend may be beginning to change.
- In late August I noted to clients that I believed that the “Delta wave” of COVID-19 would peak in early September due to re-acceleration of vaccines and in using past duration of COVID case spikes. In line with economic data trends shifting over the last ~two weeks, I believe that the worst of the current COVID wave is behind us.
Diverging Signals
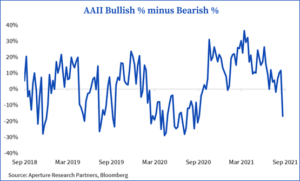
I always find it valuable when I find incongruity in data. The past week I saw a divergence in how investors feel and what they are doing. In the first chart below, you will see the AAII Investor Survey data and specifically, the % of respondents that are bullish minus those that are bearish, as a way to normalize the data. Currently the AAII survey Bulls-Bears is the most bearish since October of 2020, which for context, is when “lockdowns” were still prominent, and vaccines were not expected for at least 6-12 months.
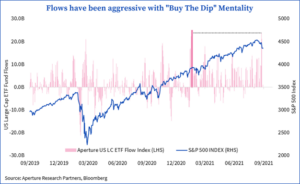
Compare the above chart with the following chart. The chart below shows our proprietary US Large Cap ETF Flow Index (overlaid with the S&P 500). Last Wednesday, our index had the largest level of inflows (trailing 1-week) since February and the second highest week of inflows in the last two years. Admittedly, flows into US large cap could be interpreted as a defensive investment (when compared to small cap, int’l, etc.) but when the level of flows is this strong, in our view, it is a sign of investor bullishness.
What’s our takeaway from these two charts and the divergence of data?
- This is a sign that investors have two fears: 1) fear that the recovery will falter and/or weaken further and 2) fear of missing out or “FOMO”.
- VERY IMPORTANT, I always put more weight in what people do (fund flows) than what they say (sentiment survey). To combine with the point above, I can tell which fear is stronger.
- The “buy the dip” approach has been working throughout the recovery. Over the last 12 months you can see: a) there has been significantly fewer periods of outflows than inflows and b) when a week of outflows occurs, the magnitude is approximately half of the periods of inflow.
- I am not part of the buy the dip crowd, nor against it but simply mindful to it and its implications – each time the “buy the dip” works, it becomes stronger AND more fragile. By this I mean investors receive positive reinforcement that “buy the dip” works, but the trade gets more crowded and therefore when markets don’t immediately reverse after a 3-5% decline, there is likely more people heading for the exits at the same time.
- Given my view that economic data is set to improve, and expectations also will be rising, I don’t think that we are in the scenario where a mild sell off turns into a correction that induces panic from everyone who has successively bought the dip over the last 12 months.
Please reach out to us ([email protected]) to discuss this post, learn how we are currently positioning portfolios or explore more about how we can help your firm.